What Is Really Happening in Indianapolis Commercial Real Estate at Midyear 2026
Q2 data shows the gap between a still-soft urban core and a suburban market absorbing demand. Here's what the broker reports don't say.

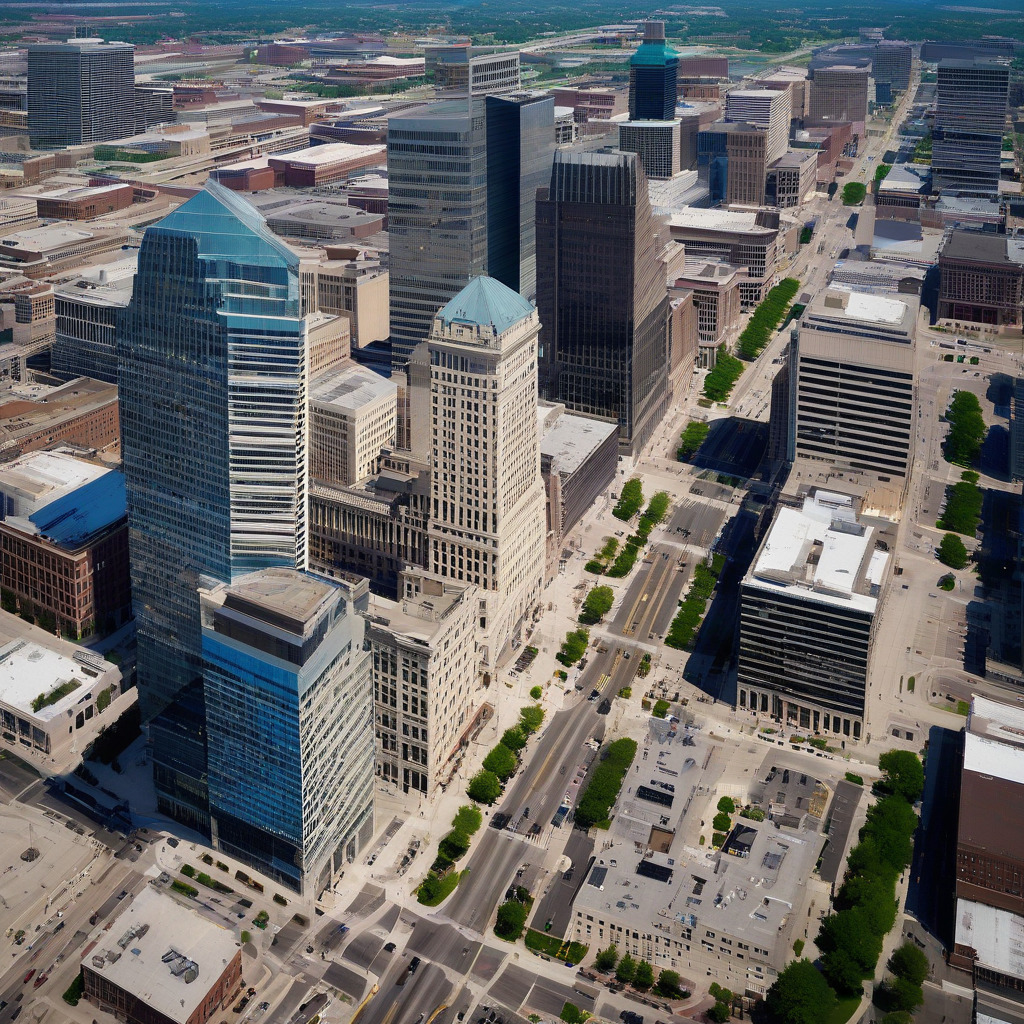
Q2 data shows the gap between a still-soft urban core and a suburban market absorbing demand. Here’s what the broker reports don’t say.
Downtown Indianapolis office vacancy has climbed sharply from its pre-pandemic Q4 2019 baseline of roughly 12 to 14 percent. By 2023 and 2024, CBRE and JLL estimates had reached somewhere in the 22 to 27 percent range depending on submarket definition. Updated Q2 2026 figures from those firms’ Indianapolis offices are the data points this analysis is built around; treat the directional picture as confirmed even where precise current numbers await quarterly release.
One thing broker-produced reports consistently understate: headline vacancy figures count direct vacancy only. Fold in sublease shadow inventory — space that’s technically occupied but actively being marketed by tenants who no longer want it — and the competitive supply available to tenants is meaningfully higher than the headline number in several downtown buildings. That gap is where tenants have the most to gain and landlords have the least cover. If a downtown vacancy figure sounds better than you expected, this is probably why.
Salesforce Tower and the Monument Circle Corridor
111 Monument Circle is the city’s tallest office address: 48 stories, 830,000 square feet. Salesforce’s naming rights and anchor tenancy shaped its identity. The reality in mid-2026 is more uncertain than that profile suggests.
Salesforce underwent significant national portfolio restructuring through 2023 and 2024, shedding space across multiple markets as it moved to a hybrid-first model. Its current Indianapolis footprint — whether any floors have been listed for sublease, returned to the landlord, or retained at original scale — hasn’t been publicly disclosed by building management, and the ownership structure hasn’t been confirmed in public filings. What the market broadly reflects is that the tower has available space. Salesforce’s actual occupancy is a material open question for anyone evaluating the Monument Circle corridor. I’d want a straight answer on that before signing anything nearby.
The softness extends beyond Salesforce’s doors. OneAmerica Tower has historically been anchored by a major owner-occupier but hasn’t been immune to broader pressures. Regions Tower has faced more acute challenges, with notable tenant turnover reported by brokers tracking the east side of downtown. Walk the corridor on a weekday afternoon. The traffic through lobbies tells you something vacancy percentages can’t. The Monument Circle spine is not functioning the way anyone hoped at this point in downtown’s recovery.
Which Tenants Moved, Stayed, or Quietly Shrank
The aggregate vacancy number only becomes useful when you know who’s behind it. Several large employers have made deliberate footprint choices over the past three years that have shaped the current market in measurable ways.
Elevance Health, formerly Anthem, has long been among downtown’s most significant tenants with operations tied to 220 Virginia Ave. Whether the company has maintained or cut its downtown footprint as hybrid work became permanent policy is a question with direct bearing on the southern downtown corridor’s health. It hasn’t been answered publicly, which tells you something about how these decisions get made. Quietly, without press releases. A major tenant sheds floors and the market absorbs the news in silence.
Elanco Animal Health relocated its headquarters to a Greenfield-area campus. Its current downtown Indianapolis presence — whether it has vacated or retained any Marion County office space — is an open question brokers active on the east side can answer. The move wasn’t dramatic or loudly public, but it was material.
IU Health is a different case. The expanding health system has made administrative office decisions with real implications for downtown Class A absorption. Whether its growth has translated into downtown demand or has been directed toward campus-adjacent facilities is genuinely hard to pin down from the outside, and it matters more than most of the other variables in this analysis.
Professional services and legal firms have accounted for some positive absorption in recent quarters, primarily in well-amenitized buildings. These deals represent genuine demand. They haven’t moved the corridor-wide vacancy needle. They’re the counternarrative, not the narrative.
Fishers and Carmel Are Filling Up — But Not with Downtown Refugees
Hamilton County’s two primary office and flex markets tell different stories in 2026. Fishers, along the 116th Street and I-69 interchange corridor, and Carmel, along the US-31 Meridian spine, are both showing vacancy well below downtown rates and absorption running positive. The directional gap between these suburban markets and downtown isn’t in dispute.
The more useful question: how much of Hamilton County’s absorption represents companies relocating from downtown, and how much is genuinely new demand? Both dynamics are present. But the suburban market’s growth appears driven more by organic Hamilton County demand than by downtown flight.
Fishers has spent a decade building commercial infrastructure along Technology Drive and Lantern Road near I-69. The city attracts technology, life sciences, and logistics-adjacent companies through active recruitment and a workforce that heavily skews toward Hamilton County residents — people who have no particular interest in commuting downtown. Launch Fishers, the coworking and startup operation at the former Spark campus, functions as a gravity well. A company that starts there and scales to 50 employees tends to expand within Fishers. The city has essentially built a retention mechanism for its own business community.
Carmel’s Meridian corridor operates differently. Several firms that have taken space there in recent years had downtown roots. Carmel offers parking ratios and vehicular access that a non-transit-dependent workforce values, and in Indianapolis, that’s most workforces. Asking rents in the Carmel Meridian Class A market are estimated in the $20 to $26 per square foot NNN range — figures that require Q2 2026 verification but have consistently undercut comparable downtown product. For a company weighing a Monument Circle location against a Carmel Meridian office, the rent differential and parking ratio usually settle the question fast.
Fishers is primarily adding demand that wouldn’t have materialized downtown regardless. Carmel is absorbing a blend of new demand and downtown defectors. Carmel, in particular, has benefited from downtown’s misfortune. Readers interested in our business and professional coverage will find ongoing reporting on similar market dynamics across the metro.
Where Commercial Construction Is Actually Concentrated in 2026
Active commercial construction in the Indianapolis metro in 2026 is almost entirely suburban and almost entirely industrial or flex. The geography of new development is where the market sees durable demand. It is not downtown office.
Plainfield and Whitestown are carrying the regional industrial and logistics pipeline. Plainfield, with direct access to I-70 and Indianapolis International Airport, has continued attracting large-footprint distribution and e-commerce fulfillment development. The speculative risk is real — these projects depend on sustained logistics demand — but the investment is happening because the underlying demand signal is real. Whitestown, along I-65 north, has seen speculative industrial construction continue, reflecting the Indianapolis metro’s genuine position as a regional logistics node.
Noblesville and Westfield, along the SR-32 and I-69 corridors, are attracting flex development. Smaller-bay industrial and office-warehouse hybrid product serves the growing northern Hamilton County business base. The Grand Park Sports Campus area in Westfield has catalyzed adjacent commercial development that nobody was really predicting a decade ago. A growing manufacturing or light-assembly business can find a 25,000-square-foot flex bay north of Westfield for a fraction of the cost and commitment of a downtown office lease. That math isn’t close.
Downtown Marion County has almost no speculative office construction in the active pipeline. The construction activity that exists downtown is concentrated in residential and mixed-use projects, renovation of existing hospitality product, and infrastructure-adjacent public investment. No developer is building speculative downtown office into a market carrying the current vacancy rate. The absence of a single shovel-ready commercial office project is the most direct signal the market is sending — and honestly the most honest data point in this whole analysis.
Retail Corridor Report Card
Mass Avenue remains the city’s tightest and most resilient retail corridor. Street-level vacancy along Mass Ave has stayed low by metro standards, and the corridor has demonstrated an ability to replace closed tenants — particularly in food and beverage — at a pace most Indianapolis neighborhoods can’t match. Asking rents along the prime Mass Ave stretch are estimated at $25 to $38 per square foot NNN. The gap between Mass Ave rents and rents elsewhere in the metro is structural, not marginal.
The corridor’s vulnerability is worth naming: Mass Ave’s identity has become so closely tied to restaurant and bar tenancy that independent retail and service tenants face genuine cost pressure. A bookstore can’t outbid a bar operator for corner retail space. That tension predates the pandemic and hasn’t resolved. Mass Ave is a hospitality corridor that happens to have some retail, not a retail corridor with restaurants. Whether that’s a problem depends on what you think the corridor should be.
Broad Ripple presents a more complicated picture. The commercial corridor along Broad Ripple Avenue has persistent vacancy pockets that reflect a structural problem the neighborhood hasn’t solved. The bar-and-nightlife identity has made it difficult to sustain the kind of daytime retail a residential neighborhood actually needs. Several storefronts that turned over in 2023 and 2024 have been slow to re-lease. Landlords who had been holding for bar or restaurant users are increasingly willing to consider daytime retail — progress, even if slow. The corridor’s parking constraints and evening-crowd reputation still create real friction for some tenant categories. A yoga studio or a law office doesn’t thrive in a neighborhood built for 11 p.m.
College Avenue through the Broad Ripple to Meridian-Kessler segment is where the most interesting independent retail recovery is playing out. The stretch has seen genuine independent retail and food-and-beverage openings over the past two years. These aren’t franchises; they’re businesses that chose the neighborhood for its walkable residential density and existing merchant mix, and the Meridian-Kessler side has particular momentum. Closures are still happening alongside openings — this isn’t a triumphant story yet. Asking rents on this segment are estimated well below Mass Ave, reflecting both the smaller customer draw and a lower barrier to entry for independent operators. It’s a story in the second or third act, not the final one.
Office-to-Residential Conversions and What the City Is Actually Doing
The city’s primary policy tool for addressing chronic downtown office vacancy is adaptive reuse — specifically, converting obsolete office buildings to residential. TIF district incentives have been directed toward projects that bring residential density to blocks where office demand isn’t expected to recover. Develop Indy and the Indy Chamber have maintained an active public posture of support.
The honest assessment at midyear 2026: the pipeline of announced projects is longer than the pipeline of projects that have broken ground or secured financing. Several downtown conversion projects that received public attention in 2024 and 2025 remain in predevelopment, working through financing structures that depend on combinations of federal historic tax credits, state incentives, and city TIF participation. That assembly takes time — a lot of time in the current interest rate environment. The gap between what’s been announced and what’s been permitted and funded reflects the real complexity of conversion economics, not bad faith from developers. A developer who can assemble the right tax credit package and TIF incentive can make a conversion work. Without that toolbox, the numbers don’t pencil.
The projects that have moved forward are concentrated in buildings whose physical characteristics make residential conversion more feasible. A 1920s bank building with small floor plates and high ceilings converts to residential relatively easily. A 1980s corporate office tower with deep floor plates and central HVAC does not — and that category is where downtown vacancy is most acute. What conversion accomplishes, over time, is removing obsolete inventory from the office count and adding residential population to blocks that currently lack it. That’s a different contribution to downtown health than filling office floors. It’s still a meaningful one, though the city shouldn’t let the conversion narrative obscure how little of the actual vacancy problem it solves.
What This Market Means for Tenants, Landlords, and Anyone Watching
This is a tenant’s market in downtown Indianapolis office space. Indiana imposes no commercial rent control, meaning lease terms are fully negotiable and there’s no regulatory floor on the concessions landlords can offer. What asking-rent figures don’t capture is the extent of concession packages downtown landlords are offering to get deals done.
Free rent, elevated tenant improvement allowances, and shorter initial lease terms are all on the table. Tenants evaluating a downtown Indianapolis location should start from the concession package, not the asking rent, and assess whether a given building’s amenity investment is genuine or cosmetic — you can usually tell pretty quickly. A $20 per square foot asking rent with 18 months free and a $75 per square foot TI allowance is a fundamentally different deal than the same asking rent at market terms. Don’t let the headline number do all the work.
For landlords, the buildings absorbing tenants in the current environment are the ones where management has been willing to meet the market on both economics and physical product. The buildings still holding out for pre-2020 terms are the ones with available space that stays available. That dynamic isn’t reversing on its own.
For investors watching from outside, the Indianapolis picture is clearer than the downtown story might suggest. Suburban industrial and flex product in Plainfield, Whitestown, and Hamilton County offers the clearest risk-adjusted play right now. Downtown office is a value-add or conversion play, not a core acquisition. If you need cap-rate certainty and tenant stability, you’re looking at Whitestown industrial — not Monument Circle. Indianapolis-area small business owners considering whether to lease or anchor in these submarkets may also want to review what Indianapolis small business owners should know about SBA loans in 2026 before committing to a long-term deal.
The defining characteristic of the Indianapolis commercial market at midyear 2026 is divergence: downtown versus suburban, office versus industrial, corridors that have held versus ones still searching for equilibrium. The market has been signaling where durable demand exists and where it doesn’t for several years running now. At some point, the signal stops being a forecast and starts being a fact.
Reporting for this piece is based on Q2 2026 market data from CBRE and JLL’s Indianapolis offices, public records from the Indianapolis Department of Metropolitan Development, and conversations with Indianapolis-area commercial brokers. Specific vacancy rates, asking rents, and tenant occupancy figures cited as directional estimates require confirmation against Q2 2026 broker releases before any investment or leasing decision is made. Key figures should be verified with CBRE Indianapolis, JLL Indianapolis, Cushman & Wakefield Indianapolis, or the SIOR Indiana Chapter.