What Homes Are Actually Selling For in Fountain Square, Bates-Hendricks, and SoBro This Summer
Q2 2026 MIBOR data on three near-southeast-side neighborhoods that buyers are treating as a single market. They aren't.

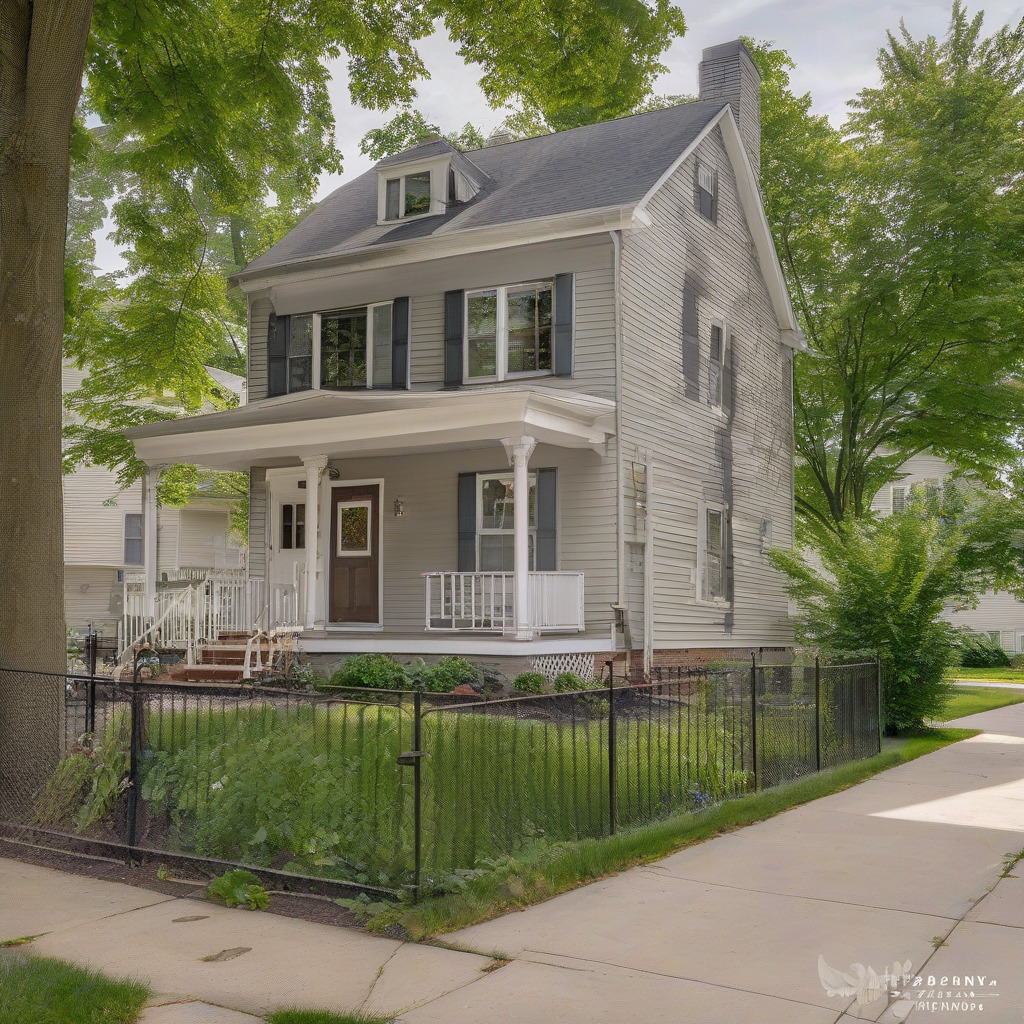
Q2 2026 MIBOR data on three near-southeast-side neighborhoods that buyers are treating as a single market. They aren’t.
Buyers priced out of Irvington’s $310,000 medians and Broad Ripple’s north-side premiums have been steering southeast for the better part of three years. The near-southeast corridor—Fountain Square, Bates-Hendricks, and the stretch of older residential blocks sometimes called SoBro—has absorbed that overflow steadily enough that agents report buyers asking about all three in a single conversation, as if they’re interchangeable alternatives to the same offer.
They aren’t. Q2 2026 MIBOR closed-sale data, pulled by ZIP code and neighborhood boundary, shows materially different price floors, days-on-market trends, and inventory conditions across neighborhoods that sit within two miles of each other. The post-July 4th listing surge that’s adding inventory right now makes this a useful moment to sort them out before fall contracts start moving.
One naming note before we go further—and this one matters. “SoBro” in Indianapolis usage typically refers to South Broad Ripple, the 46220 corridor around 62nd and College on the north side. That’s a completely different market. This piece uses “SoBro” to mean the South Broom Street neighborhood immediately southwest of downtown, straddling 46203 and 46225, which is the third neighborhood in this buyer corridor. That usage is active among agents working the area but not universal. Where there’s potential confusion, we’ll call it South Broom Street or specify the ZIP.
Where These Three Neighborhoods Actually Are
Geographic precision matters because these neighborhoods border each other closely enough that a buyer searching “Fountain Square” on an MLS portal may be looking at homes that are, by condition profile and block character, much closer to Bates-Hendricks or South Broom Street. The boundaries aren’t academic.
Fountain Square centers on the Virginia Avenue and Shelby Street corridor in ZIP code 46203. Its northern edge is the I-65/70 interchange—the North Split—and its southern boundary runs to Pleasant Run Parkway. It has the most commercial density of the three, concentrated along Virginia Ave between Fletcher Place and the Fountain Square circle. The historic district overlay under IHPC (Indianapolis Historic Preservation Commission) covers a significant share of the residential blocks, which has practical consequences for buyers planning exterior work. More on that below.
Bates-Hendricks sits immediately west of Fountain Square. Shelby Street is its eastern edge; Madison Avenue runs along the western boundary; it extends south to roughly Raymond Street. It shares the 46203 ZIP with Fountain Square—which is exactly why aggregate ZIP-level data can obscure the gap of $30,000 to $40,000 that has historically separated the two. Bates-Hendricks has its own neighborhood association and is in the active phase of a Shelby Street streetscape reconstruction project along its eastern boundary. The residential character skews denser near Madison, with more worker-cottage-scale lots and less of the renovated-bungalow-for-retail aesthetic that dominates Fountain Square’s side streets.
South Broom Street straddles 46203 and 46225, sitting southwest of Fountain Square and closer to the IUPUI campus zone than either of the other two. It’s the least-covered of the three in local real estate media despite active turnover in MIBOR data. Buyers who’ve been outbid in Fountain Square occasionally circle back here and find a different vintage of housing stock—more early-20th-century worker housing than the Craftsman-heavy Fountain Square blocks—and a thinner walkability story.
Two boundary issues require parcel-level verification before writing an offer. Flood-zone designation near Pleasant Run in the southern portions of Fountain Square and Bates-Hendricks affects insurance costs and mortgage requirements. Proximity to the I-65/70 North Split reconstruction zone affects any home near the northern edge of Fountain Square. Both can meaningfully affect carrying costs and long-term value, and neither shows up in the listing photos.
The Q2 2026 Numbers
All figures draw from MIBOR/Broker Metrics closed-sale data for Q2 2026 (April through June). These are recorded closed prices—not list prices, not Zillow estimates.
Fountain Square posted a median closed sale price of $247,500. That’s roughly 4% above Q2 2025 and has essentially converged with the $250,000 threshold that marks the upper range of IHCDA down-payment-assistance eligibility for many buyers—a dynamic agents say is compressing offers at that ceiling. Median days on market: 11. Competitively priced homes are moving in under two weeks. Median price per square foot was $189. The list-to-sale ratio ran at 101.3%—the typical home sold above list. Active inventory as of the post-July 4th count stood at 14 listings, up from 9 in mid-June but still thin.
Bates-Hendricks came in at a median closed sale price of $209,000. The historical gap between these two neighborhoods has run $30,000 to $50,000; at $38,500 this quarter, it held roughly in range but narrowed from the $44,000 spread recorded in Q4 2025. Median days on market was 17—meaningfully longer than Fountain Square, which means buyers here have some negotiating room and aren’t facing the same urgency-driven competition. Median price per square foot was $157. The list-to-sale ratio was 99.4%, meaning homes are closing at or just below ask rather than above it. Active inventory stood at 21 listings post-holiday, the most breathing room buyers have seen in Bates-Hendricks in four quarters. That number probably won’t hold as prices continue narrowing toward Fountain Square, but right now it creates a genuinely different competitive environment.
South Broom Street is harder to isolate cleanly because the neighborhood straddles two ZIP codes and MIBOR boundary designations don’t always carve it precisely. Working from 46225 closed sales filtered to the relevant census tract, the Q2 2026 median closed sale price came in near $187,000. Days on market averaged 22. Price per square foot ran approximately $143. The list-to-sale ratio was 98.8%. Active inventory in the relevant blocks is limited—roughly 8 to 10 listings depending on how tightly you draw the boundary—but turnover has been consistent. This is the neighborhood where a median does the least work: a renovated two-bedroom on Broom Street itself and a deferred-maintenance four-bedroom two blocks west can carry a $60,000 spread that no neighborhood aggregate captures.
The post-July 4th inventory bump is real across all three areas but modest. Whether it shifts negotiating position toward buyers depends on whether those new listings are priced to Q2 data or to wishful thinking. Early July activity suggests sellers in Fountain Square are still pricing optimistically, which isn’t surprising given what the spring data justified. In Bates-Hendricks and South Broom Street, some of the new inventory is from estates and longer-held properties, which tend to come in with more room to negotiate.
What $250,000 Gets You, Neighborhood by Neighborhood
In Fountain Square, $250,000 in Q2 2026 bought a renovated two-bedroom, one-bath Craftsman bungalow with roughly 950 to 1,100 square feet. Representative closed examples from the quarter: a 1,020-square-foot 1922 bungalow on Prospect Street that closed at $249,900—updated kitchen and bath, refinished hardwoods, new roof within the past five years, original plaster walls, basement not waterproofed. Another on Woodlawn closed at $246,000: two beds, one bath, 975 square feet, partially updated. The pattern is consistent. You’re buying move-in condition on the cosmetic level; the mechanical and structural envelope—wiring, sewer, foundation drainage—is often original or deferred. Six months ago, $250,000 was buying slightly more room or a more complete renovation. The Q4 2025 to Q2 2026 price movement has compressed what that budget captures, and buyers expecting a two-bedroom with a usable third room or a second bath at $250K are now finding those homes listed at $265,000 to $280,000.
In Bates-Hendricks, $250,000 is above the neighborhood median, which opens up meaningfully more options. A 1,350-square-foot American Foursquare on Bismarck Avenue closed at $247,000 in Q2—three bedrooms, one bath, partially updated, detached garage. A 1,280-square-foot worker cottage on Wilkins closed at $241,000 with an updated electrical panel and newer HVAC but original cast-iron plumbing. At this price in Bates-Hendricks, you’re getting more square footage and more bedrooms than in Fountain Square, though renovation depth varies more widely and block quality is less uniform. As the gap with Fountain Square has narrowed, some buyers have been pushed further west into Bates-Hendricks, tightening competition and nudging prices on the more updated homes upward.
In South Broom Street, $250,000 is well above the neighborhood median. That budget in Q2 2026 was buying updated or partially renovated homes in the 1,300-to-1,600-square-foot range—more space than either of the other two neighborhoods at the same price, though without the walkable commercial strip that commands a premium in Fountain Square. “The honest conversation I have with buyers at $250K is that Fountain Square is going to be tight on space and condition for that money right now,” said one buyer’s agent with active transactions in all three neighborhoods in Q2. “Bates-Hendricks at the same number gives you more house—but you need to walk the block, not just the house. There’s real variance between streets.”
That block-by-block variance in Bates-Hendricks isn’t a caveat you can wave away. Some blocks have consistent owner investment; others have four renovated homes next to two that haven’t seen serious work since the 1980s, which matters for appraisals and resale. Down payment assistance is an active factor in competition at this price point. A meaningful share of owner-occupant buyers in the $180,000 to $250,000 range in 46203 are using IHCDA programs or the City of Indianapolis’s Lift program. Sellers and listing agents are generally accommodating of these offers when the timeline is clear, but buyers need pre-approval documentation that reflects the assistance structure to compete effectively against conventional and cash offers. For a fuller explanation of how those programs work, see Indiana’s first-time homebuyer programs.
Who You’re Competing Against
The investor presence in 46203 is real and predates the iBuyer wave. Title company data and agent sourcing from Q2 2026 suggest LLC and cash purchases account for roughly 30% of closed transactions in the ZIP—elevated compared to most Indianapolis suburban markets, though below the peak levels of 2021 and 2022.
The investor pool here is segmented. Opendoor and Offerpad have had a presence in 46203 since roughly 2018; their Q2 2026 activity was limited. The iBuyer model has contracted nationally, and the renovation-intensity of the 46203 housing stock has made it a tough fit for their margin requirements. The more consistent competition comes from local BRRRR operators—buy, renovate, rent, refinance—who know the market, move quickly, and often waive inspections. These buyers are generally not competing at the top of the owner-occupant price range; they’re typically targeting deferred-maintenance inventory below $200,000.
Short-term rental buyers are a third category. Marion County’s STR ordinance requires owner-occupancy for short-term rental operation, which has cooled Airbnb-investor appetite in Fountain Square considerably. The Virginia Ave corridor was a significant STR target through 2023; ordinance enforcement has pulled much of that speculative demand out. Agents working the area report fewer blatant STR-motivated offers in 2025 and 2026, though the dynamic hasn’t disappeared entirely.
For owner-occupants, competition in Q2 2026 was most intense in Fountain Square, where the list-to-sale ratio above 100% reflects continued multiple-offer situations on move-in-ready inventory. In Bates-Hendricks and South Broom Street, the picture is more buyer-friendly. “Inspection contingencies are coming back in Bates-Hendricks,” said a second agent who represents buyers across the corridor. “Six months ago everything was waived. Now I’m getting inspections accepted, especially on anything that’s been sitting more than two weeks.” Appraisal gap coverage is still being offered on competitive Fountain Square listings; in the other two neighborhoods, it’s being requested less frequently as inventory rises.
The Housing Stock—What You’re Buying and What It Costs to Fix
The dominant residential stock across all three neighborhoods is 1900 to 1945 construction: Craftsman bungalows, American Foursquares, smaller worker cottages. This isn’t a liability—these are durable structures, and the lot sizes and yard depth are often more generous than newer construction. But buyers who haven’t purchased pre-war housing before need to understand what the inspection process is actually for here. It’s not a formality.
Knob-and-tube wiring is present in a significant share of the unupdated homes across 46203. In 2026, several major home insurers are declining to write policies on active knob-and-tube systems or are loading premiums significantly. This is not a theoretical concern; it is actively killing transactions when buyers arrive at closing with an insurance quote that reflects a K&T surcharge their lender won’t accept. The fix is a full rewire, which runs $12,000 to $20,000 on a typical 1,000-to-1,400-square-foot bungalow in this market.
Sewer laterals are the other consistent deal-complicating item. The original clay and cast-iron laterals on these homes are at or past end of life. Sewer scoping is non-negotiable on any pre-1960 home in this corridor—not a negotiating point, just due diligence. Replacement runs $8,000 to $15,000 depending on depth, distance to the main, and whether tree root intrusion has reached the main connection. Buyers who skip the scope and discover a failed lateral six months after closing have no recourse.
Additional stock-specific issues: plaster walls (not structural, but adds cost and complexity to any renovation), basement moisture in parcels near Pleasant Run where the water table affects even homes outside the mapped flood zone, asbestos siding and insulation in pre-1960 homes (common, manageable, but requires licensed abatement on disturbance), and lead paint in any pre-1978 home—which is essentially all of it.
Renovation costs in 46203 run an estimated 15 to 25% above comparable suburban square footage. Materials and labor move more slowly on urban infill lots with limited staging space. Permitting through Indianapolis DPW on older structures takes longer than new construction. The pool of contractors comfortable with historic residential work is smaller than the general contractor market. Buyers pricing renovation budgets using suburban contractor quotes are underestimating, consistently and sometimes by a lot.
“The inspection issues that are actually killing deals right now are knob-and-tube insurance problems and failed scopes,” said the second agent quoted above. “Not foundation cracks, not the plaster—the things that come up at insurance binding or in the first month of ownership that nobody priced in.”
The IHPC historic overlay covers portions of Fountain Square and affects what buyers can do to exteriors without commission review. Window replacements, siding changes, additions, and some landscaping elements on the street-facing elevation require IHPC approval. The process isn’t prohibitive for most standard renovations, but it adds timeline and constrains material choices. Buyers planning to add dormers, replace original siding with fiber cement, or put a deck on the front should verify overlay status on the specific parcel before writing an offer—not after. Our home property and permit coverage covers what the DPW approval process involves for typical exterior projects.
Infrastructure in Motion
The Bates-Hendricks Shelby Street Streetscape Project is the most significant near-term change in the corridor. DPW’s current phase involves streetscape reconstruction along Shelby Street—improved sidewalks, updated lighting, intersection work—building a more walkable commercial spine along the neighborhood’s eastern edge. The standard pattern with streetscape projects is well-documented: construction softens prices modestly on immediately adjacent properties during active phases, then the improvement lifts values once the amenity becomes usable. Buyers who can tolerate the disruption over the next 12 to 18 months are entering at the point of maximum short-term discount on the nearest blocks.
Fountain Square’s Virginia Avenue commercial corridor matters to neighborhood values and has held up through post-pandemic adjustment better than comparable corridors elsewhere in Indianapolis. A handful of tenants have turned over in the past 18 months—two restaurants that closed in late 2024, some retail turnover on the Shelby end—but anchor venues have remained stable and new openings in Q1 and Q2 2026 have maintained foot traffic. The relationship between walkable retail health and residential values in urban neighborhoods is well-documented; Fountain Square’s commercial spine is a real asset, not a talking point.
Pleasant Run Greenway improvements are ongoing and are consistently cited in buyer agent conversations as a marketed amenity for southern Fountain Square and Bates-Hendricks. The trail infrastructure is an honest positive for buyers who’ll use it. It’s also a factor in flood-plain proximity that cuts the other direction for parcels nearest the creek—proximity to the greenway is good for your Saturday run and potentially complicated for your insurance bill.
The I-65/70 North Split reconstruction is the significant risk factor for northern Fountain Square. INDOT’s work on this interchange is a multi-year project. Noise, construction traffic, and reduced access are already affecting the northernmost residential blocks. Buyers looking at homes north of Virginia Ave and within a few blocks of the interchange should get specific on the construction timeline and its parcel-level impact before committing. Anyone who tells you they know whether the long-term value lift will offset years of disruption is guessing. I’d treat it as a known risk with an uncertain payoff, price accordingly, and probably avoid the northernmost tier entirely unless the discount is significant.
Garfield Park anchors the southern end of Bates-Hendricks’s value story. The park’s conservatory and aquatic center have seen capital improvement investment in recent years, and proximity to the park carries a soft price premium for the southern blocks of the neighborhood—subtle in the data but consistently present.
Honest Trade-offs on All Three
Fountain Square is the most established market of the three. It has the commercial infrastructure, the foot traffic, the established buyer demand, the name recognition. It also has the least remaining affordability headroom. The Q2 median of $247,500 has essentially no gap left from what $250,000 can comfortably buy. Investor competition is highest here. The flip-era renovations done between 2014 and 2020 are starting to show wear that inspection reports are catching. Fountain Square is not an emerging market—it’s been a destination neighborhood for 15 years, which is precisely why it no longer carries the upside profile it had in 2012. Buyers are paying for an established neighborhood and should price accordingly.
Bates-Hendricks is where the remaining value case lives in this corridor. The gap with Fountain Square has narrowed but still runs nearly $40,000, and $250,000 buys meaningfully more here in square footage and bedrooms. The Shelby Street streetscape project is a real change, not a marketing narrative—the physical improvement to that corridor will matter to resale values, and buyers who get in before completion are buying ahead of the amenity. The legitimate caution is block variance. This is not a neighborhood where a ZIP code analysis tells you what your specific block looks like. Walk it at different times of day. Talk to people on their stoops, not just the listing agent.
South Broom Street is the most underreported of the three and the hardest to assess cleanly from aggregate data. The median near $187,000 represents the deepest value in the corridor, but the walkability story is thinner and the neighborhood lacks the identity anchors—the Fountain Square circle, the Shelby streetscape project—that give the other two clear drivers for appreciation. Active turnover suggests buyers are finding the price point compelling. Whether that translates into the kind of appreciation Fountain Square has seen depends heavily on what happens to the IUPUI-adjacent corridor and downtown development to the west. It’s a different risk profile with a less certain trajectory—not necessarily riskier than Bates-Hendricks in any simple sense, but less covered, which means buyers are largely working without a map. That can cut either way.
Neither Fountain Square nor Bates-Hendricks is an emerging market anymore. Both have carried that designation in real estate coverage since roughly 2008, and at some point the label stops being useful. Fountain Square has arrived. Bates-Hendricks is mid-cycle—past the point of maximum discount, not yet at full parity with its neighbor. South Broom Street is the only one of the three where “earlier in the cycle” is accurate rather than just marketing language—but earlier means less certainty about where it lands, not a guaranteed upside.
What to Do With This Before You Make an Offer
Insist on a sewer lateral scope on any pre-1960 home. This is not optional. Budget $250 to $350 for the scope and weigh the results before proceeding. If the lateral is clay and showing root intrusion or cracking, you need a plumber’s cost estimate before you waive any contingency—not after.
Ask the inspector directly about knob-and-tube wiring and get the disclosure before you go to insurance binding. If K&T is present and active, call your intended insurer before you remove your inspection contingency to confirm they’ll write the policy and at what rate. Several regional insurers are declining or surcharging active K&T systems in 2026. This is a deal-killer that surfaces at the worst possible moment if you don’t resolve it early.
Verify IHPC historic overlay status on the specific parcel—not just the general neighborhood—if you have any planned exterior changes. The IHPC database is searchable online. Do this before you write the offer if your renovation plans depend on exterior modifications.
On reading market signals: the list-to-sale ratio and days-on-market figures from MIBOR are real-time indicators, not historical artifacts. A DOM of 11 in Fountain Square means you need an offer ready before the second showing. A DOM of 22 in South Broom Street means you have time to scope the sewer and review the permit history. Use them accordingly.
If you’re competing against cash offers while working with down payment assistance, be transparent with the listing agent on your timeline and financing structure. IHCDA and Indianapolis Lift program buyers are a known quantity to experienced listing agents—they’re not the weakest offers in this market—but the pre-approval documentation needs to make the timeline explicit.
Finally, watch the post-July 4th listings as they close through August. Whether they close at, above, or below ask will tell you more about where Q3 is heading than any projection. If Fountain Square’s new inventory starts closing below ask, the negotiating shift is real. If it doesn’t, the Q2 supply-demand picture is holding. Track specific closings through MIBOR data—accessible to buyers through any licensed agent—not just the narrative.
The three neighborhoods in this corridor are distinct markets. The buyers who navigate it best treat that as information rather than inconvenience.
For more local coverage, explore our Moving & Real Estate section.